
Fixing Memory Leaks in a Closed Source (x86) Application

I don’t think that it is common, but it is something that I had to do: I run a Neverwinter Nights server and because it is quite large, the memory usage of the process was climbing by around 100 megabytes every hour. It is not an issue for normally sized servers, so those memory leaks never got fixed, but for me it was so I started looking for a way to fix them. As oppose to what you may be thinking, not having the source code doesn’t make it much “harder” to fix memory leaks. It is just a matter of having the right tools and knowing the tricks
I don't think that it is common, but it is something that I had to do: I run a Neverwinter Nights server and because it is quite large, the memory usage of the process was climbing by around 100 megabytes every hour. It is not an issue for normally sized servers, so those memory leaks never got fixed, but for me it was so I started looking for a way to fix them.
As oppose to what you may be thinking, not having the source code doesn't make it much "harder" to fix memory leaks. It is just a matter of having the right tools and knowing the tricks
I can now say that I have fixed most of them. My server can now run for possibly months without blowing out the memory and it allowed me to fix other bugs what were related to those memory leaks. I just wonder now why the developers didn't run a simple memory leak test before releasing Neverwinter Nights 1.
The Tools
I tried using existing tools, like Valgrind, but they were giving me way too many false positive and unwanted information, they were conflicting with my custom plugins for which I wanted to test for memory leaks too and they were making the game run incredibly slow. I am sure that they are good tools, Valgrind saved my code more than once, by detecting an otherwise impossible to find memory corruption, but in that case, it was overkill. So instead, I made my own tool: a simple library that record the memory allocations and let me manage them and it works very well.
Then to fix the leaks found, all what is needed is a debugger that supports read, write and conditional breakpoints like GDB.
Creating the Leak Detection Plugin
What my plugin does is to hook the malloc, calloc, realloc and free functions to keep track of the allocated blocks that are not freed and then provide external commands to manage and display that information.
The hook is done by creating a method with the same prototype and then loading the plugin with LD_PRELOAD so that my functions override the original ones. For example:
void* (*malloc_org)(size_t) = NULL;
void* malloc(size_t size)
{
	if (malloc_org == NULL)
	{
		malloc_org = (void* (*)(size_t))dlsym(RTLD_NEXT, "malloc");
	}
	if (!hook_malloc) return malloc_org(size);

	hook_malloc = false;
	void* result = malloc_org(size);
	record_allocation(size, result);
	hook_malloc = true;
	return result;
}
The hook_malloc flag is there to prevent the library from recording its own allocations because, obviously, it would create an infinite loop.
The record_allocation function is used to store the information about the allocations. I store them into two map structure:
// Keep rack the total number of allocation and size done by a specific stack trace.
std::map alloc_info_by_caller;
// Keep track of the stack trace of each allocation
std::unordered_map alloc_info_by_allocptr;
With those 2 maps, I can keep track of all allocations and display them easily by their stack trace.
The next step is to provide a way to display and manage the information available in those 2 maps. To do that I first had to hook a function that parse a user input. In my previous article, I explain how it is possible to find and hook the chat in the client application: http://www.innobec.com/en/blog/desktop-software/creating-plugin-closed-source-x86-application
In this case, the server is a console application so I just had to hook the sscanf call that parse console commands:
//Hook of the the sscanf call when processing a command line input
int OnProcessKeyboardInput_SScanf(const char* src, const char* format, char* result)
{
	bool prev_hook_malloc = hook_malloc;
	hook_malloc = false;
	// Display the contents of alloc_info_by_caller
	if (strncmp(src, "print", 5)==0)
	{
		for (auto iter=alloc_info_by_caller.begin(); iter!=alloc_info_by_caller.end(); iter++)
		{
			printf("%u/%u bytes allocated at:\n", iter->second.total_size, iter->second.alloc_count);
			iter->first.print();
			printf("\n\n");
		}
	}
	// Clear the the maps
	else if (strncmp(src, "clear", 11)==0)
	{
		alloc_info_by_caller.clear();
		alloc_info_by_allocptr.clear();
		printf("alloc cleared!\n");
	}
	// Display the size of the maps
	else if (strncmp(src, "count", 15)==0)
	{
		printf("alloc by caller:%u total:%u\n", alloc_info_by_caller.size(), alloc_info_by_allocptr.size());
	}
	// Enable recoding the allocations
	else if (strcmp(src, "hook")==0)
	{
		check_malloc = true;
		printf("free/malloc hook enabled\n");
	}
	// Disable recording the allocations
	else if (strcmp(src, "unhook")==0)
	{
		check_malloc = false;
		printf("free/malloc hook disabled\n");
	}
	hook_malloc = prev_hook_malloc;
	return sscanf(src, format, result);;
}
Finding a Memory Leak with the Custom Plugin
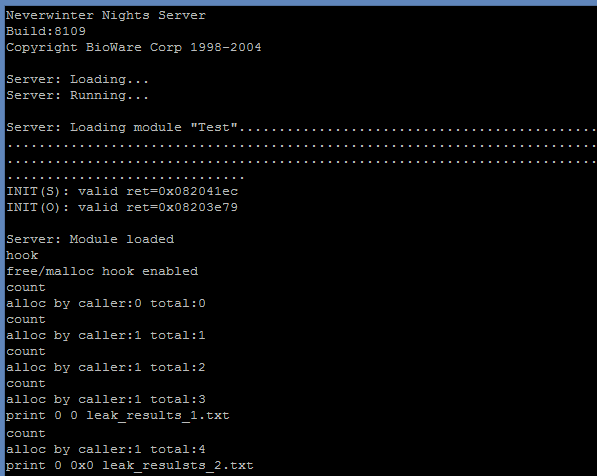
I will do the most basic test: make sure that the server is not leaking when it is suppose to be doing nothing.
- I start the server with the plugin.
- When the server is fully loaded and appear to be doing "nothing", I enable the monitoring of allocations. The number of allocations should be at 0 at this point.
- I wait 5 minutes and print the number of allocations. It should still be at 0. But in this case it is not...
- I wait another 5 minutes and print the number of allocations again. It has doubled, it is very suspicious, so I print the allocations that have not been freed.
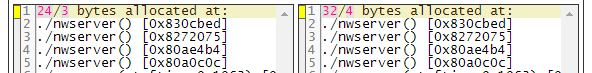
- I do the same as step 5, so now I have 2 lists of allocations. Here's my screen so far:
- I compare the output of the step 4 and 5 and I can see that the allocation done with a specific stack trace is apparently leaking.
Fixing the Memory Leak
At the beginning, I was hoping to have only to do this:
void* last_server_allocation = NULL;
void* alloc_server_hook(long size)
{
	if (last_server_allocation) free(last_server_allocation);
	last_server_allocation = malloc(size);
	return last_server_allocation;
}
But it was not that easy. In all cases, the allocated memory was stored in an object for later use. So I had to track how this allocated memory was used.
In this case I only got one stack trace, but normally a get a long list of leaked stack trace. So the first step is to find the top level leak:
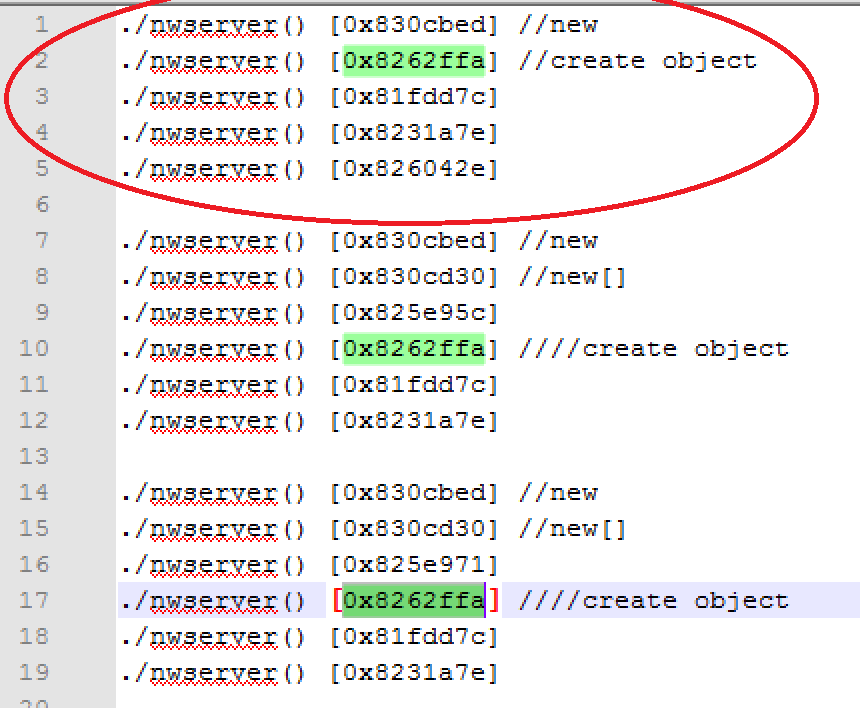
Finding where the pointer is stored
The first place where it is stored can normally be easily found by looking at the assembler code:
   0x08272070 <+32>:    call   0x830cbc4 //call new
   0x08272075 <+37>:    mov    %eax,%ebx //allocated memory moved in %ebx
   0x08272077 <+39>:    lea    -0xc(%ebp),%eax
   0x0827207a <+42>:    push   %eax
   0x0827207b <+43>:    push   %esi
   0x0827207c <+44>:    pushl  0xc(%ebp)
   0x0827207f <+47>:    push   %ebx
   0x08272080 <+48>:    call   0x827428c
   0x08272085 <+53>:    mov    %ebx,0xc(%esi) //allocated memory moved in 0xc(%esi)
But then it is always possible that the pointer be shared and stored at other places later, so to be safe, I had to try tracking all its usages. For that, I add a read breakpoint where it is first stored and then at every subsequent places:
//Add a breakpoint where  the memory is allocated
(gdb) break *0x08272085
Breakpoint 6 at 0x8272085
(gdb) cont
Continuing.
//The memory is allocated
Breakpoint 6, 0x08272085 in CConnectionLib::ServerConnectToGameSpy(unsigned int) ()
//Add a read watch point at the address that will contain the pointer
(gdb) print /x $esi+0xc
$4 = 0xe90f3cc
(gdb) rwatch *0xe90f3cc
Hardware read watchpoint 7: *0xe90f3cc
(gdb) cont
Continuing.
//First place where the allocated memory is accessed, I updated the watch point so that it doesn't break here anymore.
Hardware read watchpoint 7: *0xe90f3cc
Value = 391371808
0x0827213b in CConnectionLib::HandleServerGameSpyMessage(unsigned long, unsigned char *, unsigned long) ()
(gdb) delete 7
(gdb) rwatch *0xe90f3cc if ($eip != 0x0827213b)
Hardware read watchpoint 8: *0xe90f3cc
(gdb) cont
Continuing.
//Second place where the allocated memory is accessed, I updated the watch point so that it doesn't break here anymore.
Hardware read watchpoint 8: *0xe90f3cc
Value = 391371808
0x0827211c in CConnectionLib::UpdateGameSpyServer(void) ()
(gdb) delete 8
(gdb) rwatch *0xe90f3cc if ($eip != 0x0827213b && $eip != 0x0827211c)
Hardware read watchpoint 9: *0xe90f3cc
(gdb) cont
Continuing.
//Back to where the memory was allocated
Breakpoint 6, 0x08272085 in CConnectionLib::ServerConnectToGameSpy(unsigned int) ()
//This is to confirm that the memory will be allocated again for the same object
(gdb) print /x $esi+0xc
$5 = 0xe90f3cc
(gdb)
In this case, the pointer is only accessed at the addresses 0x0827213b and 0x0827211c and it is not to store it somewhere else. The only way to know it though is by looking at the assember of functions at those addresses.
Finding when the reference is lost
This will probably be the place where the allocated memory should be freed. To find it, I simply add a write breakpoint at every address holding a pointer to the allocated memory:
(gdb) print /x $esi+0xc
$4 = 0xe90f3cc
(gdb) watch *0xe90f3cc
Hardware watchpoint 10: *0xe90f3cc
(gdb) cont
Continuing.
Hardware watchpoint 10: *0xe90f3cc
Old value = 391371808
New value = 409354776
0x08272088 in CConnectionLib::ServerConnectToGameSpy(unsigned int) ()
(gdb) cont
Continuing.
Hardware watchpoint 10: *0xe90f3cc
Old value = 409354776
New value = 412182400
0x08272088 in CConnectionLib::ServerConnectToGameSpy(unsigned int) ()
(gdb)
Continuing.
So in this case, the only place where the reference will change is just after where it is allocated.
Calling free on the memory holding the reference wont trigger the breakpoint by default, but this is easily solved with the custom plugin:
memset(ptr, 0, mem_alloc_info.size);
Finding when it could be freed
The last thing that could affect when or where that I need to free the allocated memory is if it gets already freed under certain conditions. To find those cases, I could use a write watch point on the allocated memory (when it will be freed, the plugin will reset the memory) but the simplest is to add a command to the plugin to make it record when a specific allocation gets freed:
inline void unregister_allocation(void* ptr)
{
	auto allocptr_iter = alloc_info_by_allocptr.find(ptr);
	if (allocptr_iter != alloc_info_by_allocptr.end())
	{
		MEM_ALLOC_INFO& mem_alloc_info = allocptr_iter->second;
		//check if the allocation is being watched
		for (int i=0; i
[...]
	if (strncmp(src, "watch", 5)==0)
	{
		long ptr;
		if (sscanf(src, "watch 0x%lx", &ptr)==1)
		{
			watch_ptr = (void*)ptr;
			watch_result.clear();
			printf("watching *0x%lx\n", ptr);
		}
	}
	else if (strcmp(src, "clear_watch")==0)
	{
		watch_ptr = NULL;
		watch_result.clear();
		printf("watch cleared!\n");
	}
	else if (strcmp(src, "print_watch")==0)
	{
		for (auto iter=watch_result.begin(); iter!=watch_result.end(); iter++)
		{
			iter->print(stdout);
			fprintf(stdout, "\n\n");
		}
	}
The result is:
hook
free/malloc hook enabled
watch 0x08272075
watching *0x8272075
print_watch
./nwserver() [0x830cdd6]
./nwserver() [0x82720a3]
./nwserver() [0x80ae4b4]
./nwserver() [0x80a0c0c]
./nwserver() [0x804bbe7]
So now, knowing that the memory allocated by the call the address 0x08272070 can possibly be freed by the call at the address 0x0827209e and the reference is reset every time that that a new instance is allocated, the fix is:
void* last_server_allocation = NULL;
void* alloc_server_hook(long size)
{
	if (last_server_allocation) free(last_server_allocation);
	last_server_allocation = malloc(size);
	return last_server_allocation;
}
void free_server_hook(void* ptr)
{
	free(ptr);
	if (last_server_allocation == ptr)
	{
		last_server_allocation = NULL;
	}
}
[...]
hook_call(0x08272070, (long)alloc_server_hook);
hook_call(0x0827209e, (long)free_server_hook);
Conclusion
One thing that I learned with this experience is that finding and fixing a memory leak is not a matter of trial and error. Even if you don't understand the code behind, with simple tools and it is even possible to write your own, you can collect all information needed to make a software completely leak free.
In my case, the next step is to run the live server with my plugin to detect from where the remaining few megabytes of memory that leak daily come from. It is in fact possible to load this lightweight plugin on a production environment without affecting considerably the user experience.